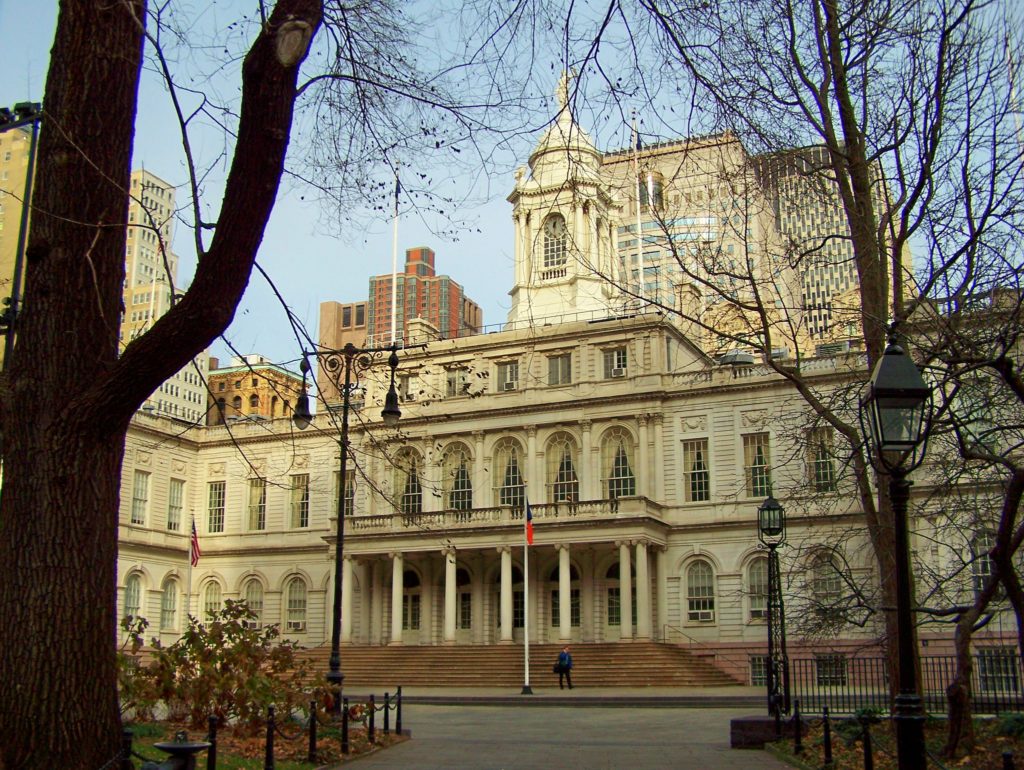
Photo courtesy of Tom Link via Flickr
NYC Districting Commission, the entity tasked with redrawing the 51 New York City Council maps following the 2020 census results, voted 13-1 to approve and submit to the City Council the latest newly redrawn maps, during a public meeting held on Thursday, Oct. 6.
These maps were revised from both the preliminary plan published by the Commission in July and a proposed revised plan submitted in September that was not approved by the Commission during a meeting on Sept. 22. The maps represent a response to over 12,500 submissions offered by New Yorkers in person or via Zoom during more than 35 hours of public hearings; by email; and by regular mail.
The chair of the Commission, Dennis Walcott, said, “Overall, the redistricting process has revealed New Yorkers’ diversity, dynamism and public participation, despite the pandemic and socioeconomic challenges. New York is still growing, ever changing, and our urban democracy is alive and well.”
The virtual meeting, was recorded via live stream and is being made available to watch on nyc.gov/districting. The revised maps took into account feedback on the latest versions of the maps which were not approved by the commission on Sept. 22.
We're live! Tune in to our Public Meeting here: https://t.co/NijeD2TXiw
— NYC Districting Commission (@DistrictingNYC) October 6, 2022
As reported, the commission held a series of hearings where the City’s residents were able to testify on the draft maps released by the commission on July 15. The commission was initially due to vote on the final council maps on Sept. 22 but, as above, those maps were rejected, as reported by Gotham Gazette. A YouTube video of the Sept. 22 session can be watched here.
On Friday, Sept. 23, the commission published a version of that revised plan on its website nyc.gov/districting. It was revised from the preliminary plan published by the Commission in July, and in response to the, at the time, over 9,600 submissions offered by New Yorkers in person or via Zoom during public hearings; by email; and by regular mail.
Commission officials said the challenge in drawing the plans this year was the city’s explosive population growth to 8.8 million. According to the 2020 Census, the city grew by 630,000 people, the equivalent of the entire population of the city of Memphis. Fifty-five percent of this new population is Asian. Twenty-four percent is Hispanic.

Photo by Miriam Quiñones
At the same time, they said the population of non-Hispanic Blacks in the city decreased by 84,000 while the white population decreased by 3,000 people overall.
To reflect these major new population changes and bring the new districts in line with the new 5 percent deviation state law, the latest “Revised Plan” has a range of 168,560 to 177,204 persons (the previous law had a 10 percent permissible deviation.) Now, the population in these council districts cannot deviate from a range of 5 percent deviation from 172,882, the ideal district population. The maps were revised from the preliminary plan, creating a Staten Island-Brooklyn “cross-over” in District 50, to more balance the other 48 districts in population, and five borough district allocations throughout the city, commission officials said.
To ensure that the Revised Plan was in compliance with the federal Voting Rights Act of 1965, the Commission engaged Dr. Lisa Handley, a national expert on Racial Bloc Voting Analysis (RBV).
The commission had previously held a special, virtual, educational seminar on “racial bloc voting analysis,” with a recorded live stream on www.nyc.gov/districting on Aug. 11, to comply with the Federal Voting Rights Act. Handley provided the commission with an educational seminar on the background and methodology used in racial bloc voting analysis, commission officials said.

Photo by Miriam Quiñones
They said her latest analysis has shown that the Revised Plan continues to provide minority voters with an opportunity to elect their preferred candidates. Officials said Black, Hispanic and Asian voters maintain their voting strength; and Asians, as the fastest growing minority group in the city, have the opportunity to elect their candidates of choice, in a new drawn district 43 in Brooklyn.
Commission officials added that after hearing concerns from commissioners on potential further edits to the September version of the maps, the commission voted not to submit that draft revised plan to the City Council in September. However, it made the rejected plan available to the public, nonetheless, via its website.
Further public meetings were held on Thursday, Sept. 29 and Friday, Sept. 30, pursuant to the City Charter, which obliged the commission to revise the plan and vote to submit it to the City Council. The commission met on these dates to discuss these revisions to the plan.
As previously reported, a new city council plan is drawn every ten years following the U.S. Census to bring the city into compliance with the constitutional doctrine of one-person, one vote, the Voting Rights Act of 1965, and the charter of the City of New York.
The “NYC Districting Commission 101 Primer,” published on June 21, is a 16-page document which explains the redistricting process, covering everything from the U.S. Constitution to the U.S. census, and the Charter of the City of New York.

Photo by Miriam Quiñones
The primer also includes the “2022 Five Percent Deviation Guide” that commission mapmakers are using to draw the new 51 city council maps. The city’s population grew by 630,000 people based on the 2020 Census count, and now totals 8.8 million people. Under the one-person, one-vote doctrine of the U.S. constitution, the 51 city council maps must be redrawn with a new average population of 173,631 residents per city council district.
The Five Percent Deviation Guide shows the current deviation of each of the 51 city council districts from the new average per district. For example, one district has a 20.3 percent deviation, while another has a negative 10 percent deviation. Commission chair, Dennis Walcott, said of the city redistricting process a few months ago, “We’ve had so much interest from the public at our hearings, we decided to do more outreach.”
He added, “Over time, we hope that the primer and deviation guide become tools to encourage New Yorkers to engage in the process, including and especially, submitting their own testimony about the drawing of the 51 new city council maps.”

Source: Center for Urban Research, CUNY Graduate Center
The city’s population grew from 8.2 million in 2010 to 8.8 million in 2020, according to the census, an increase the size of the city of Detroit. To reflect this growth and to bring the City in line with federal, State, and local laws, as above, the new preliminary maps raised the average number of residents per City Council district from 160,710 to 172,882.
When the commission released the first draft proposals of the 51 redrawn city council district maps on July 15, commission officials said 60,000 people viewed the preliminary maps, which were made available on the commission’s website at nyc.gov/districting, and 500 people testified in person, by zoom, or email during the first round of public hearings. A Bronx hearing held at Hostos Community College can be watched here. A further Bronx hearing was later held on Aug. 17 at Lehman College and can be watched in two parts here and here.
Meanwhile, as reported, the CUNY Graduate Center launched a “Redistricting & You” online map focused on the NYC Council districts, similar to what the center recently created for the New York State and congressional redistricting process. The link to the various City maps can be found at: https://nyc.redistrictingandyou.org/.
Just like with the New York State and congressional maps, the website enables the public to quickly determine their current City Council district, view helpful information about each district and now also see how the proposed district plans will impact them.
The NYC Redistricting & You site shows the current City Council districts, as well as the draft plans proposed by NYC Districting Commission. CUNY officials said at the time of the launch of the tool that if any outside stakeholders submitted proposals for new council districts, the center would add those to the site so that the public could easily compare the current and proposed lines.

Source: Center for Urban Research, CUNY Graduate Center
Members of the public can click on the map or enter an address to select any district. Redistricting & You displays information such as the relevant city council district’s 2020 population, deviation from the citywide district average population, voting age population by race/Hispanic origin, vote results from the 2021 mayoral election, and voter enrollment statistics.
Click here to see an example of the existing map for City Council District 11 in The Bronx by moving the adjusting tool (located in the center) to the left, along with the various proposed District 11 maps, some of which have since been rejected, by moving the adjusting tool (located in the center) to the right.
CUNY officials said the district’s population was just over 4 percent below the citywide average district population, meaning the district boundaries had to be expanded to include more people per the new State law that applies to NYC. Attached also are two static maps that show the population deviation patterns across the City for the current city council districts, as well as the population changes from 2010 to 2020 by city council district.
On the Redistricting & You site, members of the public were able to add map overlays to show local voting age population or enrollment patterns within each district and across the City.


